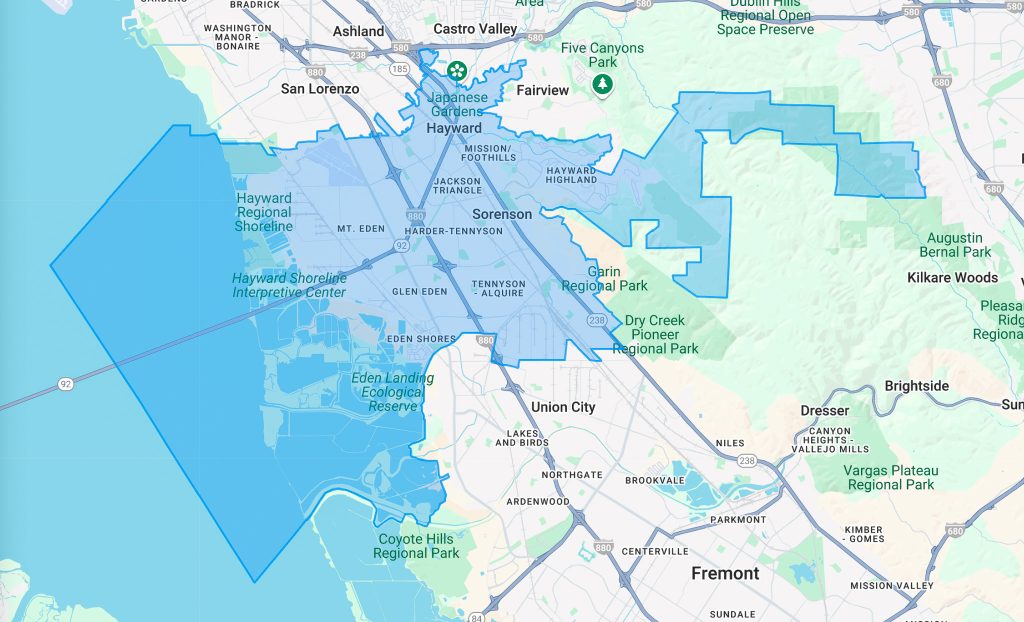
Hayward, CA Real Estate Market Report: December 2024 Insights for Buyers and Sellers
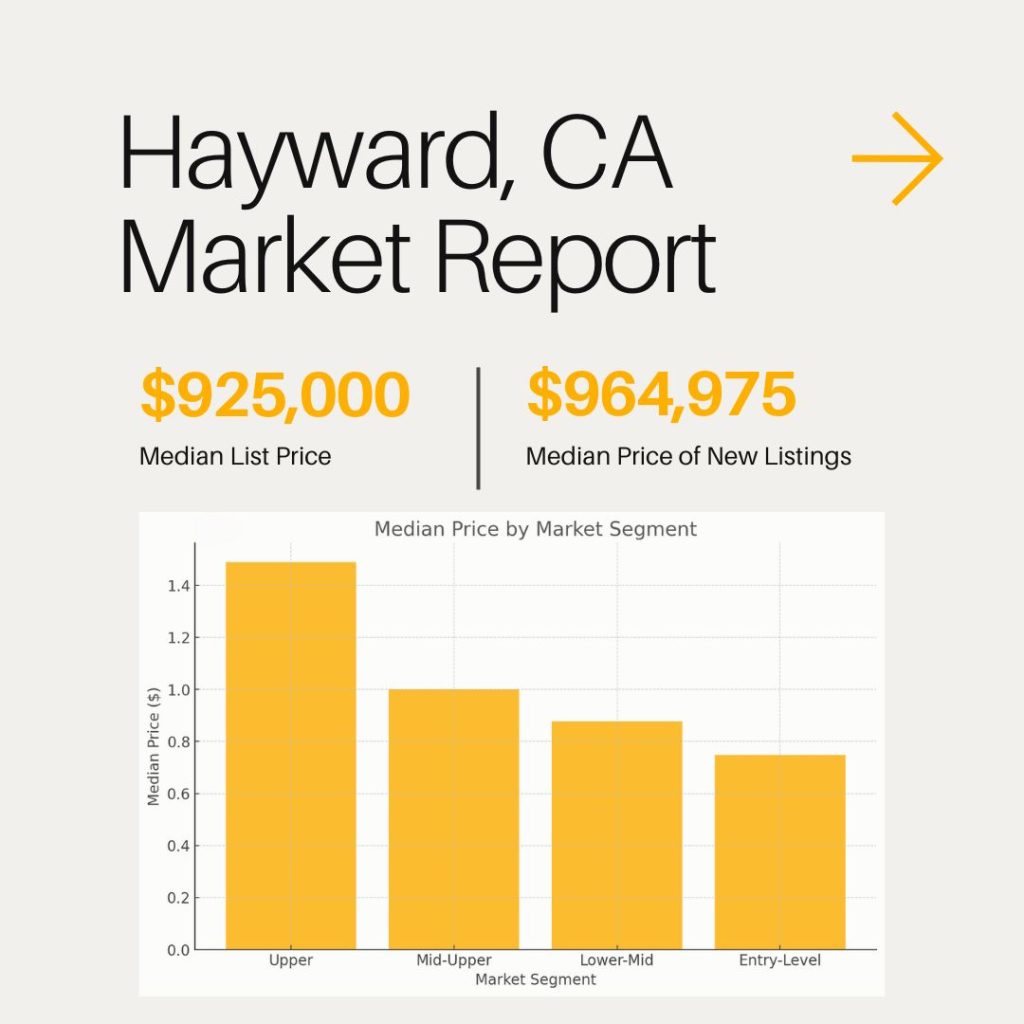
Hayward, CA Homes Report – as of Dec 1st 2024
Hayward, California, is a great place to buy or sell a house this December. Whether you want to buy, sell, or invest, understanding the market in Hayward will help you make informed decisions. This blog will discuss the current trends, important numbers, and what you can expect if you want to buy or sell a house in this bustling part of the Bay Area. Let’s dive in!
House Prices and New Listings
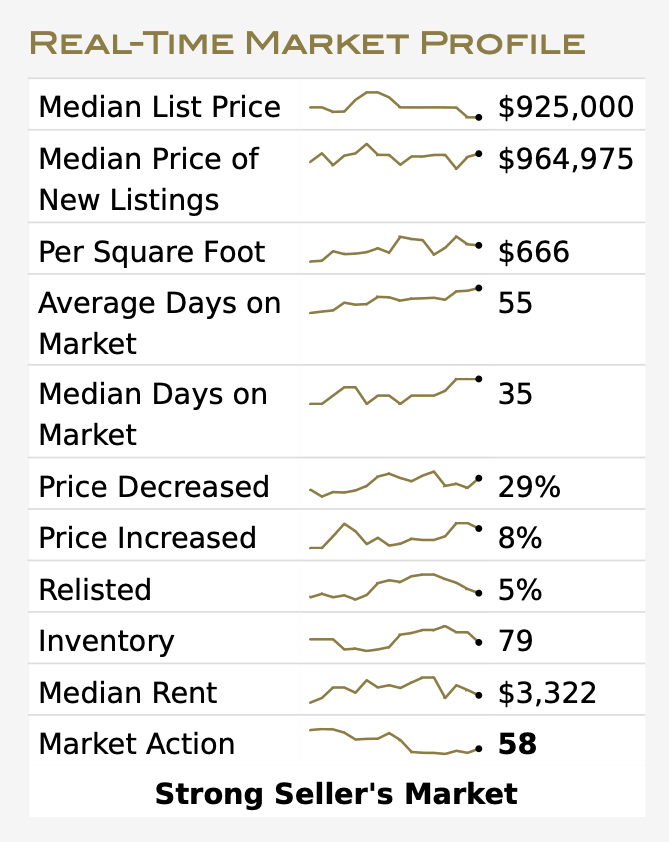
Currently, the median price for houses in Hayward, CA, is $925,000. New houses listed have a median price of $964,975. This means new houses are a bit more expensive, possibly due to upgrades or better locations.
Price Per Square Foot
The price per square foot in Hayward is $666. This number has remained stable for a while, which means the market is steady. Home buyers can expect consistent values, and sellers might consider listing now before any major changes occur.
Days on Market and Inventory
Houses in Hayward are staying on the market for about 55 days, with a median of 35 days. This means half of the homes sell quickly, while others take a bit longer. Currently, there are 79 houses for sale. The number of houses has decreased from last month, indicating that homes are selling quickly, making it a seller’s market.
Market Action Index
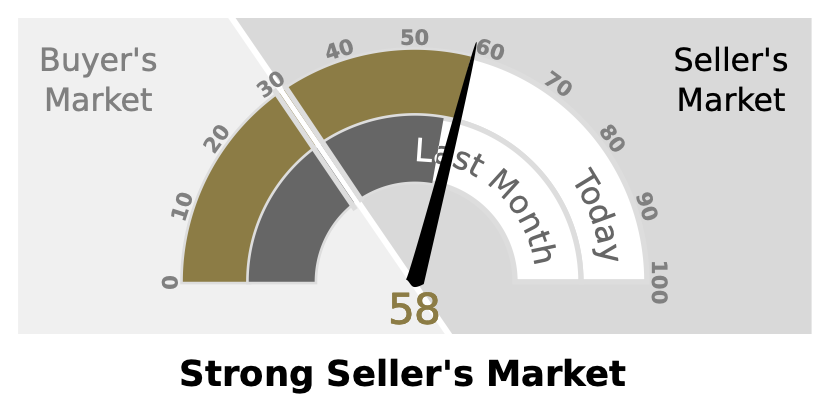
The Market Action Index (MAI) measures market activity by comparing the rate of sales versus inventory. Right now, the MAI is at 58, up from last month’s 56. This means there is more activity, and sellers are in a strong position. When the MAI is above 30, it’s considered a strong seller’s market, meaning sellers have an advantage because many buyers are looking to buy.
Price Changes and Relisted Homes
Some houses have had price adjustments. About 29% of homes have lowered their prices, while 8% have increased them. This indicates that sellers are trying to align with buyer expectations. A small percentage of homes (around 5%) have been relisted, which could mean sellers needed to adjust their plans.
Rent Prices
The median rent for houses in Hayward is $3,322. This makes buying a house for rental purposes an attractive option, as rent prices are high and there is significant demand for rentals in the Bay Area.
Market Segments
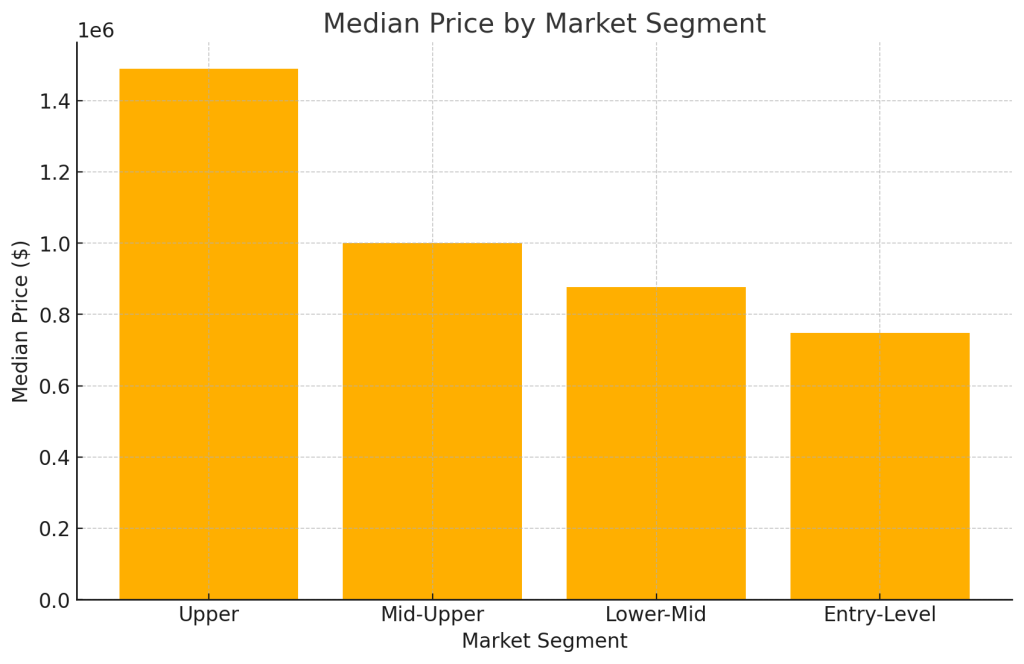
Let’s break down the market into four groups:
Upper Group:
Median Price: $1,488,888
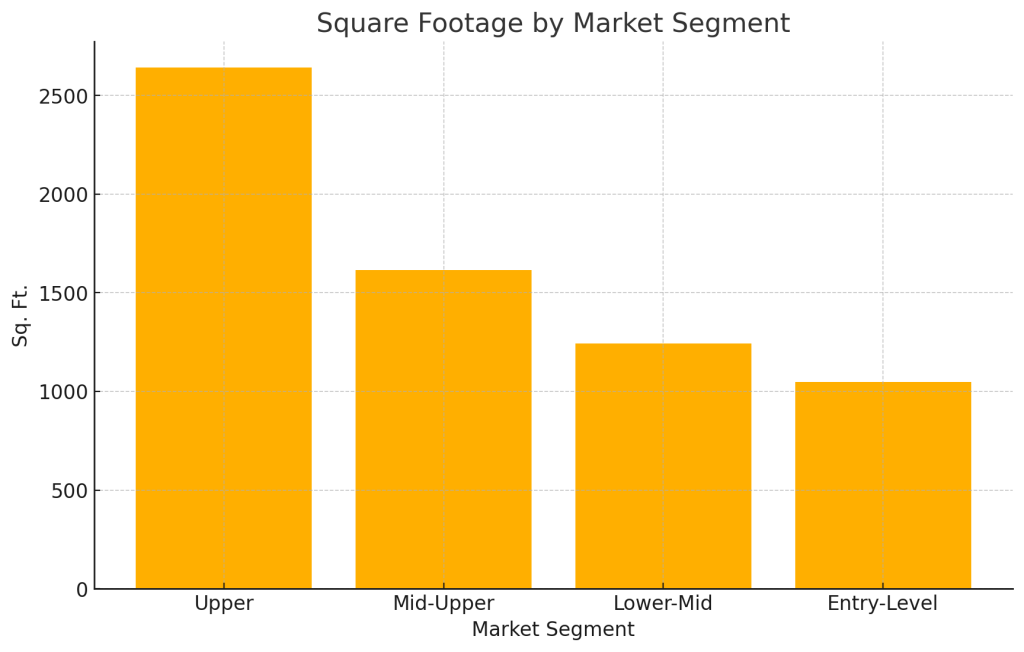
Home Size: These homes are larger, about 2,641 square feet, with lot sizes ranging between 8,000 – 10,000 sqft.
Beds and Baths: Typically, homes in this segment have 4 bedrooms and 2.5 bathrooms, offering more space and comfort, which is ideal for larger families or buyers looking for luxury.
Age: The homes are around 46 years old, suggesting they may have undergone significant renovations to maintain appeal in the high-end market.
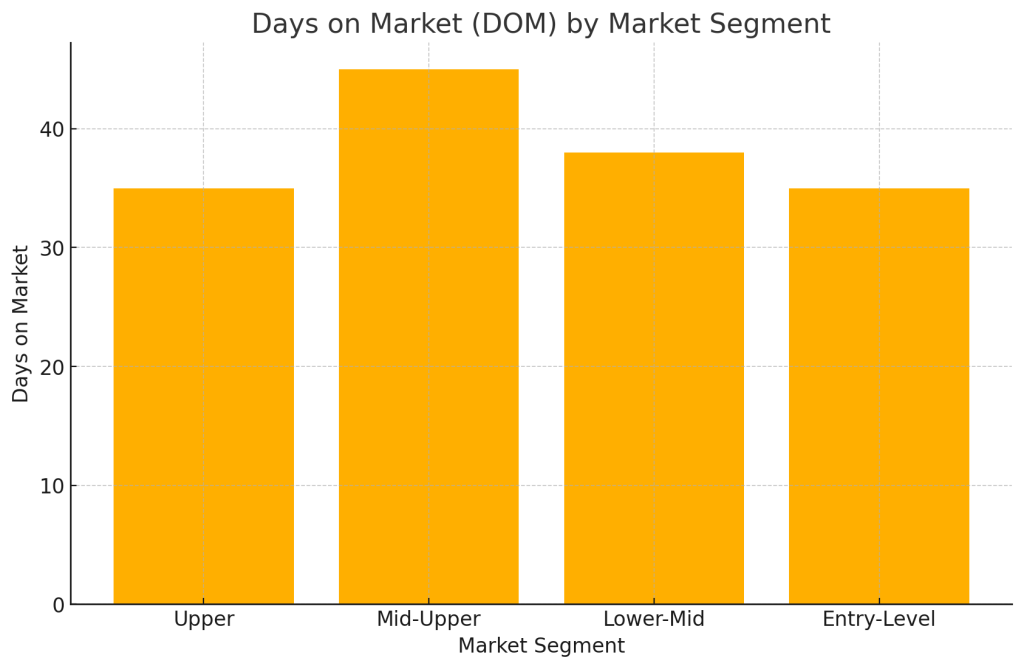
Time on Market: On average, these homes take 35 days to sell, indicating steady demand for premium properties.
Absorption Rate: The segment has an absorption rate of 5, meaning five homes have been sold recently, showing healthy activity in this price range.
Mid-Upper Group:
Median Price: $999,399
Home Size: These homes average around 1,616 square feet, with lot sizes between 4,500 – 6,500 sqft.
Beds and Baths: Homes in this group usually feature 3 bedrooms and 2.5 bathrooms, making them ideal for small to medium-sized families who are looking for a balance of space and cost.
Age: The average age is 66 years, which may imply the need for some updates or modernization, but many homes have been improved to meet current buyer expectations.
Time on Market: Homes in this category generally take 45 days to sell, slightly longer compared to other segments, which suggests buyers may be considering multiple options before making a purchase.
Absorption Rate: With an absorption rate of 7, it shows good buyer interest, especially given the balance between price and amenities.
Lower-Mid Group:
Median Price: $877,500
Home Size: Average size of 1,242 square feet with lot sizes also between 4,500 – 6,500 sqft.
Beds and Baths: These homes typically have 3 bedrooms and 2 bathrooms, making them appealing to first-time homebuyers or those downsizing.
Age: The homes are around 72 years old, which means they may have more charm but could also require some maintenance.
Time on Market: The 38-day average days on market shows a relatively quick turnaround, suggesting that well-priced homes in this segment attract buyers looking for value.
Absorption Rate: The absorption rate of 4 indicates solid interest, even though this segment is priced lower than the mid-upper range.
Entry-Level Group:
Median Price: $748,000
Home Size: These are smaller homes, around 1,047 square feet, with lot sizes of 4,500 – 6,500 sqft.
Beds and Baths: Typically featuring 3 bedrooms and 1 bathroom, these homes are perfect for first-time buyers or investors looking for rental properties.
Age: Homes are 74 years old, often providing a mix of historic charm and opportunities for renovations.
Time on Market: On average, homes in this group take 35 days to sell, showing strong interest from buyers due to affordability.
Absorption Rate: The rate of 7 indicates that entry-level homes are moving quickly, reflecting their appeal to budget-conscious buyers and investors.
What Does This Mean for Buyers and Sellers?
For sellers, now is an excellent time to sell in Hayward. With fewer homes available and high buyer demand, sellers can expect competitive offers.
For buyers, although competition is strong, there are still good opportunities to buy a home, especially if you are prepared. Many homes have lowered their prices, which means buyers may be able to negotiate deals.
Easy-To-Understand Charts for the Hayward Market
Median List Price: Staying around $925,000.
Market Action Index: At 58, indicating a strong seller’s market.
Inventory: Declining, which means many buyers are purchasing homes.
(These charts are created using the latest data to help you understand the trends.)
Conclusion
The Hayward, CA real estate market is currently a strong seller’s market, with many buyers and not enough homes for sale. Whether you are buying, selling, or investing, understanding these trends will help you make the best decisions. Working with a local expert is the best way to navigate this busy market.
For more help or to discuss your plans, reach out to me—I’m here to assist you with all your real estate needs in Hayward and beyond.
Property Search in Hayward: https://HarvinderBalu.com/HaywardRE
https://bit.ly/HaywardRE
Direct Link for this post: https://harvinder.dscloud.me/blog/12/01/2024/hayward-december-2024/
Alameda County : Latest Inventory & Market Update: https://Harvinder.dscloud.me/blog/reports-by-cities/alameda-county/

Coming Soon: 36391 Cherry Street, Newark CA – Public Records Only
Coming soon listing at 36391 Cherry Street in Newark, California. Please note that the interior of this home has not yet been viewed, and all

What Does It Mean to Have a Dual Agent in Real Estate?
When you’re diving into the Bay Area real estate market, you might hear the term “dual agent” and wonder what it means for you as

Bay Area Housing Affordability: New California Reforms for 2025
Governor Newsom signs the 2025 housing affordability and infrastructure reforms in Sacramento. California faces a real housing challenge; any relief is welcome. Recently, on July
Related Posts

Transform Your Home’s Value Instantly with Stunning Curb Appeal

Newark, CA – Insights into the Hot Real Estate Market: Low Inventory, High Demand🔥 and Rising Prices 💰

California New Foreclosure Protection Law (AB 2424): What Bay Area Homeowners Need to Know
About The Author
Harvinder Balu
Harvinder Balu | CA DRE 02195792 | 510-600-3425 | info@RealtorHarvinder.com | http://www.RealtorHarvinder.com
Add a Comment
Cancel reply
This site uses Akismet to reduce spam. Learn how your comment data is processed.
