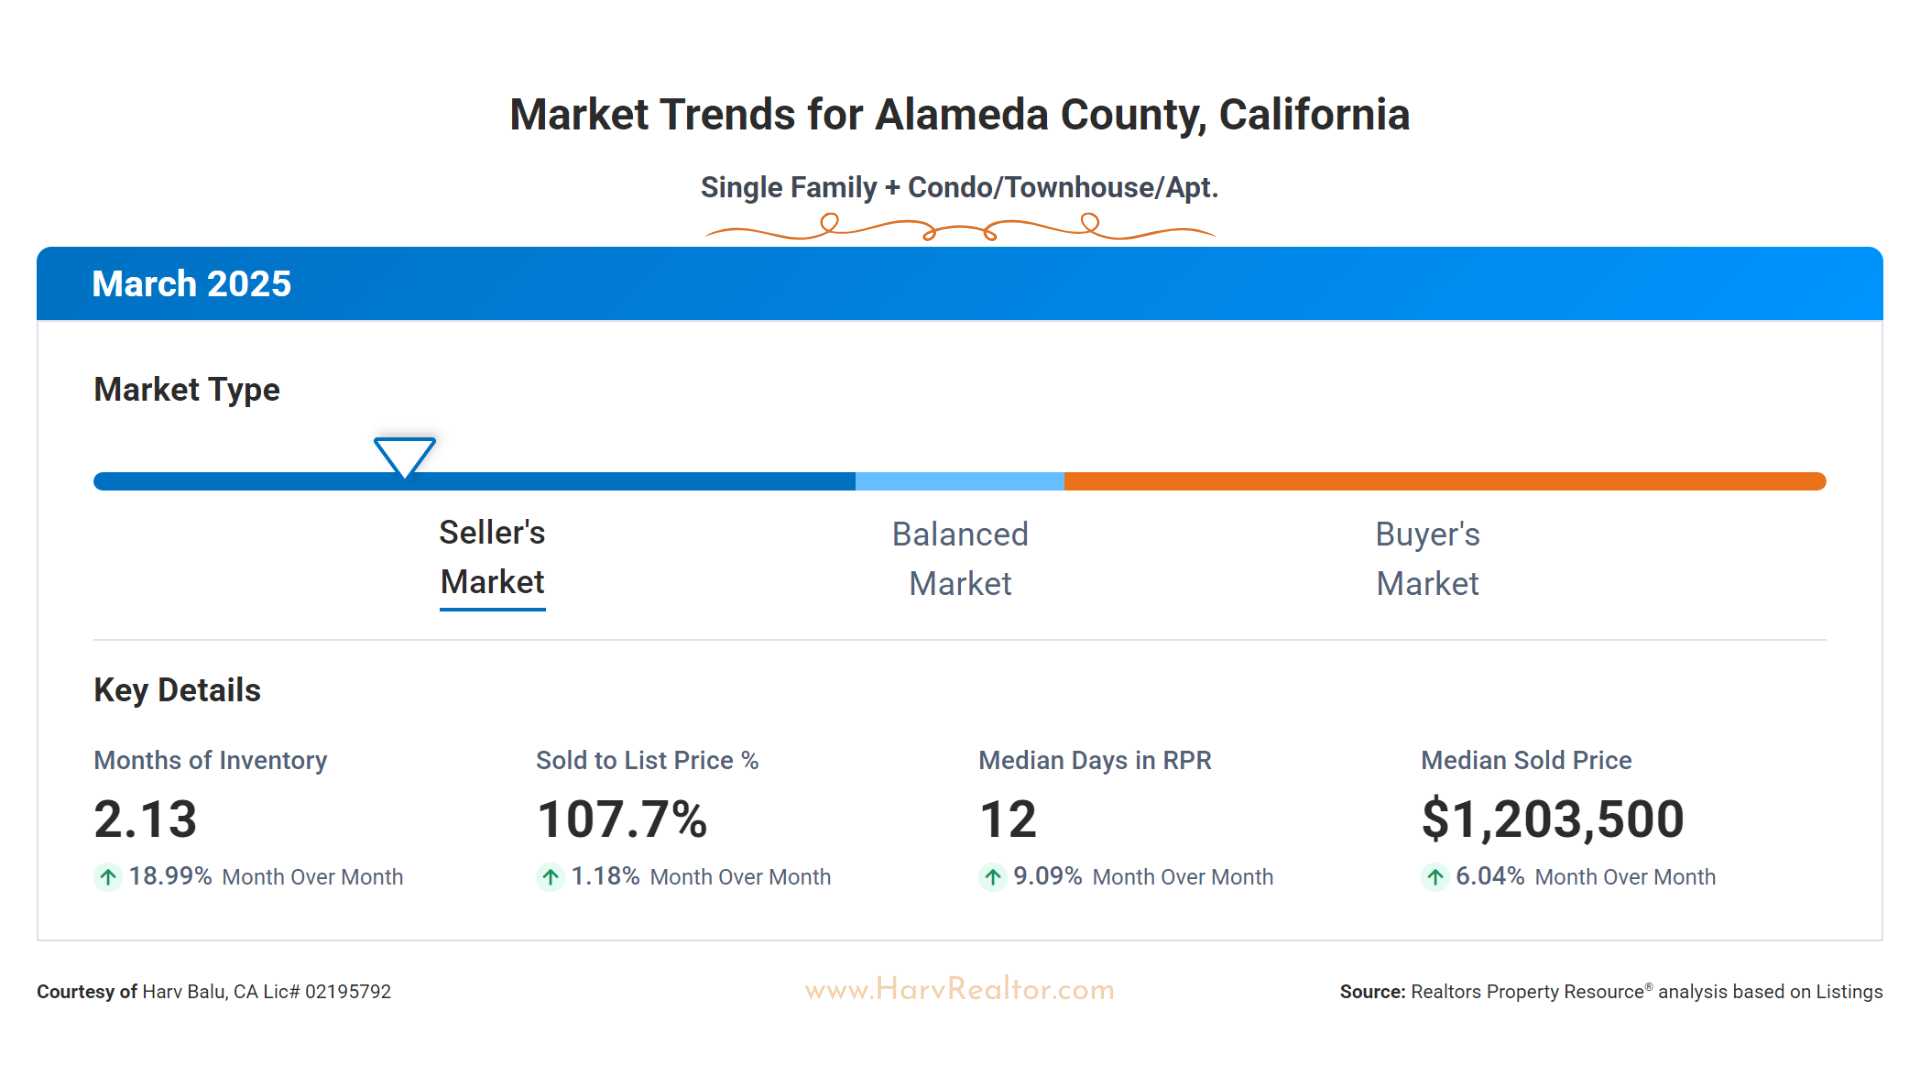
Harvinder Balu
Alameda County real estate landscape with our Report blog. Stay ahead of the market trends, discover new listings, and make informed decisions as we provide you with a daily dose of valuable insights into the dynamic property inventory.
Alameda County Interactive As of March 24, 2025
Cities | New | CS | DE/DU | PEND | CO | TH | Active All | All | DU | DE | CO/TH |
---|---|---|---|---|---|---|---|---|---|---|---|
FREMONT | 31 | 49 | 182 | 98 | 89 | 57 | 141 | 328 | 10 | 172 | 146 |
UNION CITY | 7 | 8 | 55 | 28 | 15 | 17 | 40 | 87 | 1 | 54 | 32 |
CASTROVAEY | 6 | 9 | 68 | 38 | 11 | 18 | 41 | 97 | 2 | 66 | 29 |
DANVILLE | 26 | 11 | 128 | 58 | 16 | 21 | 62 | 165 | 6 | 122 | 37 |
HAYWARD | 24 | 24 | 139 | 73 | 60 | 52 | 123 | 251 | 4 | 135 | 112 |
LIVERMORE | 28 | 18 | 158 | 75 | 20 | 18 | 66 | 196 | 7 | 151 | 38 |
NEWARK | 7 | 7 | 54 | 43 | 26 | 16 | 37 | 96 | 1 | 53 | 42 |
PLEASANTON | 34 | 13 | 127 | 49 | 15 | 29 | 70 | 171 | 2 | 125 | 44 |
SAN RAMON | 19 | 15 | 101 | 60 | 58 | 15 | 69 | 174 | 2 | 99 | 73 |
DUBLIN | 23 | 19 | 70 | 31 | 59 | 19 | 63 | 148 | 1 | 69 | 78 |
SANLEANDRO | 13 | 5 | 70 | 36 | 19 | 15 | 44 | 104 | 1 | 69 | 34 |
The real estate market in Alameda County remains in Seller’s Market territory this February, with homes continuing to sell quickly and competitively. Key highlights include:
Months of Inventory: 1.67 (up 17.61% month-over-month)
Sold to List Price Ratio: 106.7% (homes are selling above list price)
Median Days on Market: 11 days (homes are selling faster, down 52.17%)
Median Sold Price: $1,150,000 (up 24.83% month-over-month)
This indicates strong buyer demand and limited supply—great news for sellers!
January 2025 Median Estimated Property Value – Alameda County
The latest property value trends for Alameda County, California show a median estimated home value of $1,175,470.
Key Insights:
- Last Month Change: -0.8% (Slight decline in value)
- 12-Month Change: +1.7% (Steady annual appreciation)
The long-term market trend indicates consistent property value growth, despite minor month-over-month fluctuations. Alameda County remains a high-value market compared to state and national averages.
January 2025 Months Supply of Inventory – Alameda County
The latest data for Alameda County, California shows an increase in housing inventory, impacting market dynamics.
Key Insights:
- Current Months of Inventory: 1.36 months
- Last Month Change: +34.7% (Significant month-over-month increase)
- 12-Month Change: +19.3% (Year-over-year rise in available listings)
This rise in inventory suggests a shift toward more options for buyers, though the market still leans toward sellers. If you’re considering buying or selling, now is the time to strategize!
Links:
Direct link for this post:Â https://harvinder.dscloud.me/blog/reports-by-cities/alameda-county/
Fremont:
Direct link for Fremont market reports:Â https://harvinder.dscloud.me/blog/category/cities/fremont/
Newark:
Direct link for Newark market reports:Â https://harvinder.dscloud.me/blog/category/cities/newark/
Union City:
Direct link for Union City market reports:Â https://harvinder.dscloud.me/blog/category/cities/union/
Link to MLS Listings for Fremont, Newark, Union City: http://RealtorHarvinder.com
