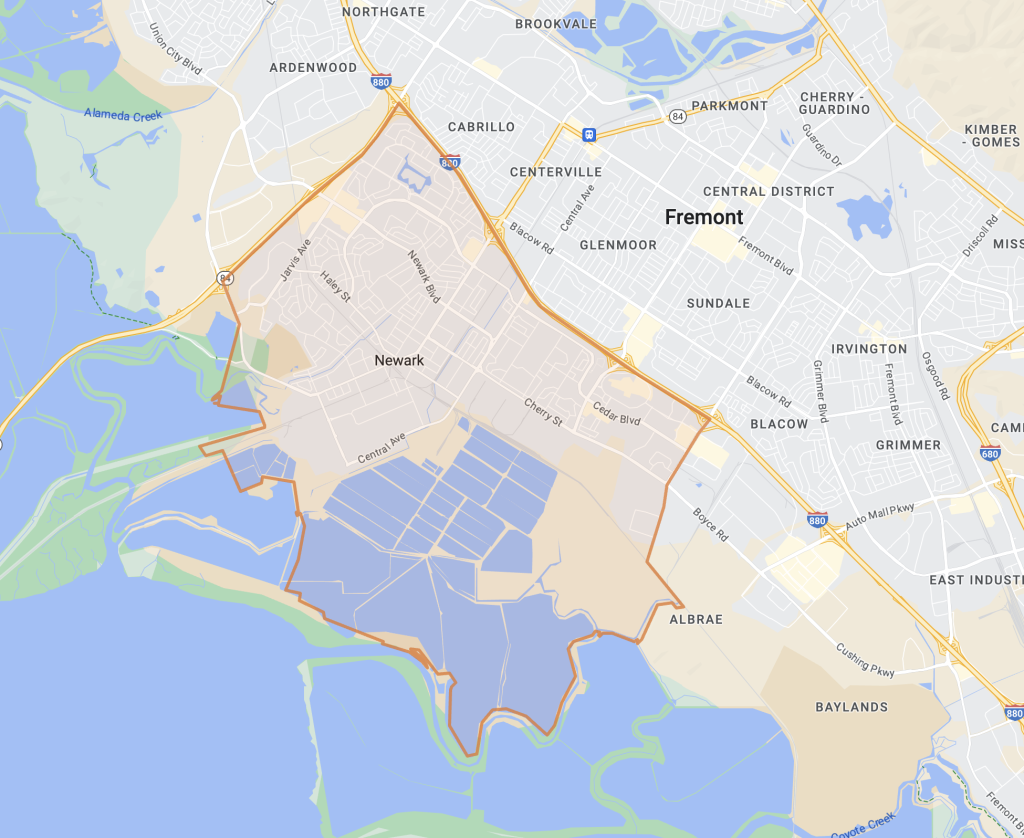
Newark, CA Real Estate Market Insights Nov. 2024 -Strong Seller’s Market Continues
Newark, CA Real Estate Market Update – Nov. 2024
The Newark, California real estate market is experiencing some dynamic shifts as of November 2024. If you are considering buying or selling a home in Newark, understanding the latest market trends can help you make an informed decision. This blog provides a detailed overview of current market data, highlighting the median prices, inventory, and what it means for buyers and sellers.
Median List Price and Market Trends
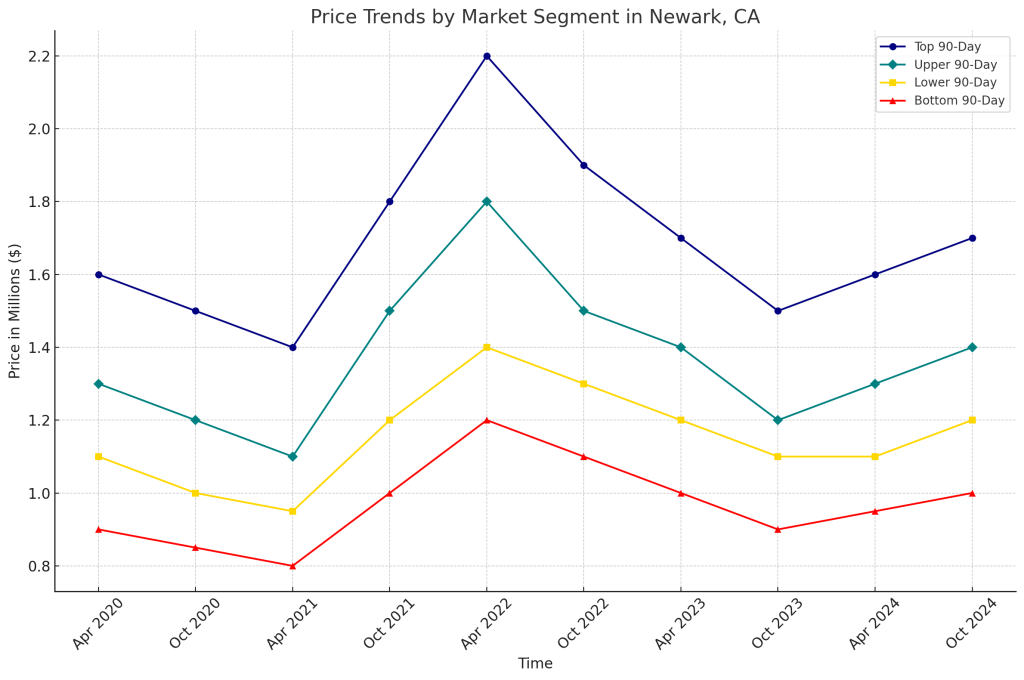
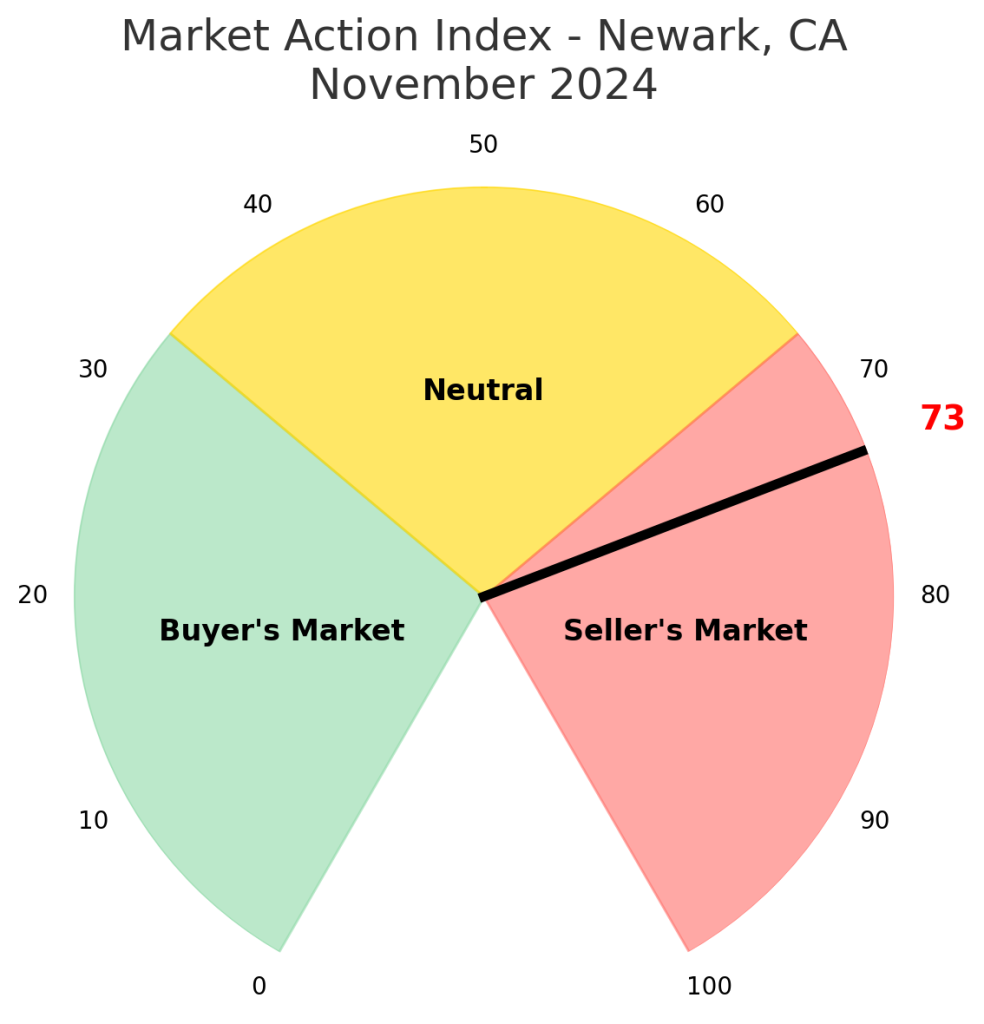
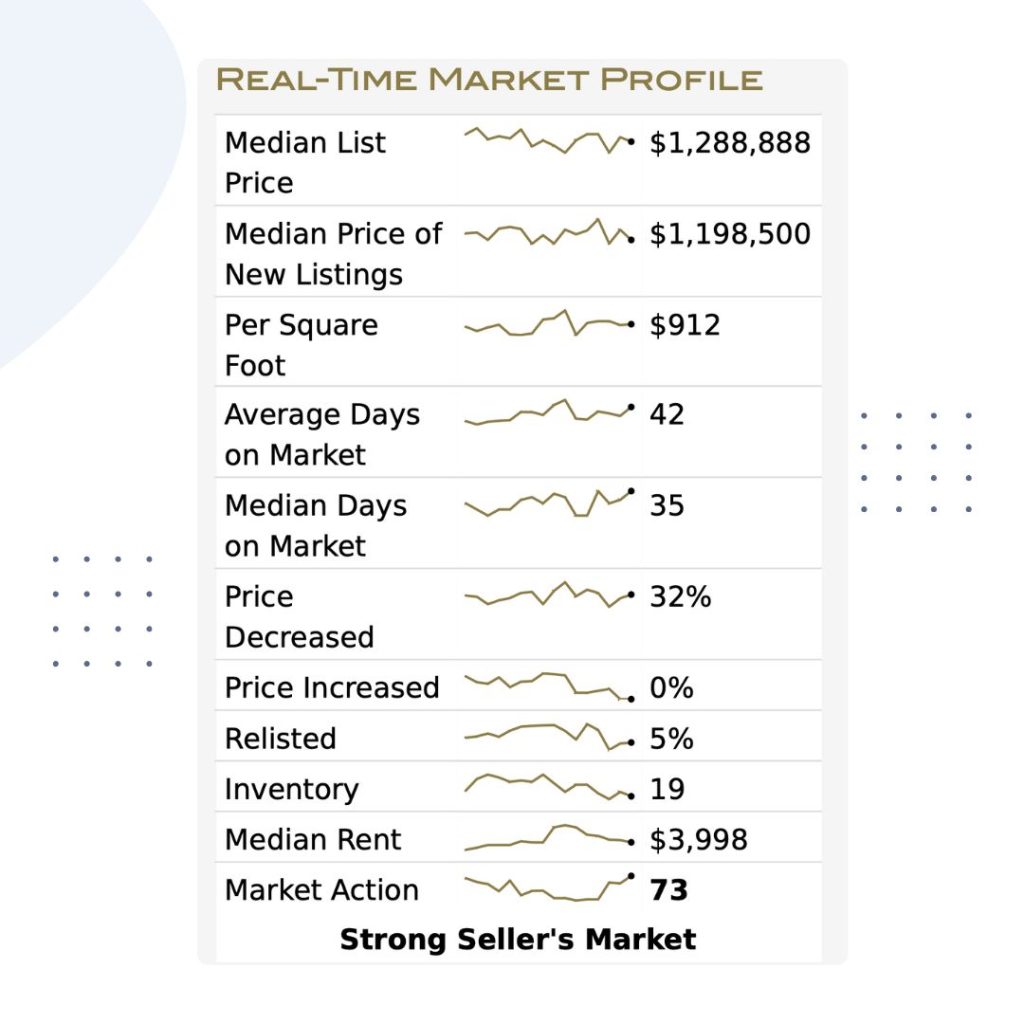
The median list price for single-family homes in Newark, CA currently stands at $1,288,888. This is a positive indicator, especially as the market action index, a measure of demand versus supply, has increased to 73, signaling a strong seller’s market. Compared to last month’s index of 64, Newark has seen increased buyer activity, suggesting growing demand for properties in the area.
For prospective buyers, this could mean increased competition for available homes, while sellers might find themselves in a more favorable position, potentially receiving multiple offers and benefiting from upward pricing pressure.
Price Segmentation
The Newark market can be divided into four distinct price segments:
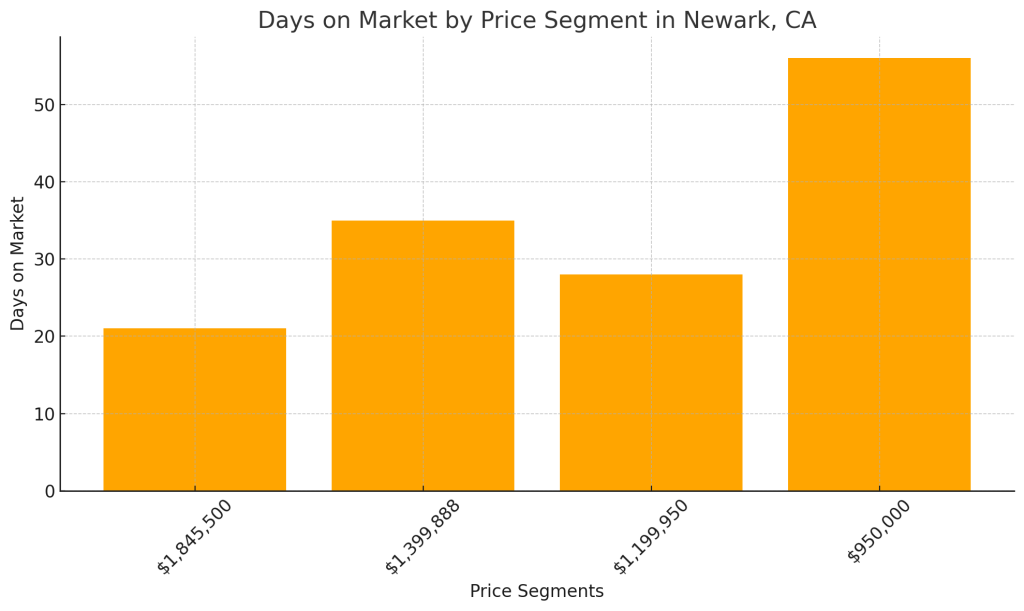
$1,845,500 – Larger homes with a median size of 2,260 sq. ft., typically offering 4 bedrooms and 3 bathrooms. These properties are situated on 6,500 – 8,000 sq. ft. lots and average 21 days on the market.
$1,399,888 – These homes average 1,438 sq. ft. with 4 bedrooms and 2 bathrooms, often on similar lot sizes as the higher-end segment. They tend to stay on the market for around 35 days.
$1,199,950 – Properties with 1,304 sq. ft., offering 3 bedrooms and 2 bathrooms, are selling at a median price of around $1.2 million and average 28 days on the market.
$950,000 – The most affordable segment in the Newark market, these homes are around 1,100 sq. ft. with 3 bedrooms and 1 bathroom, often taking 56 days to sell.
If you’re a buyer, understanding these market segments is crucial to determining where your budget fits. If you are a seller, this information helps you position your property more effectively depending on the segment it falls within.
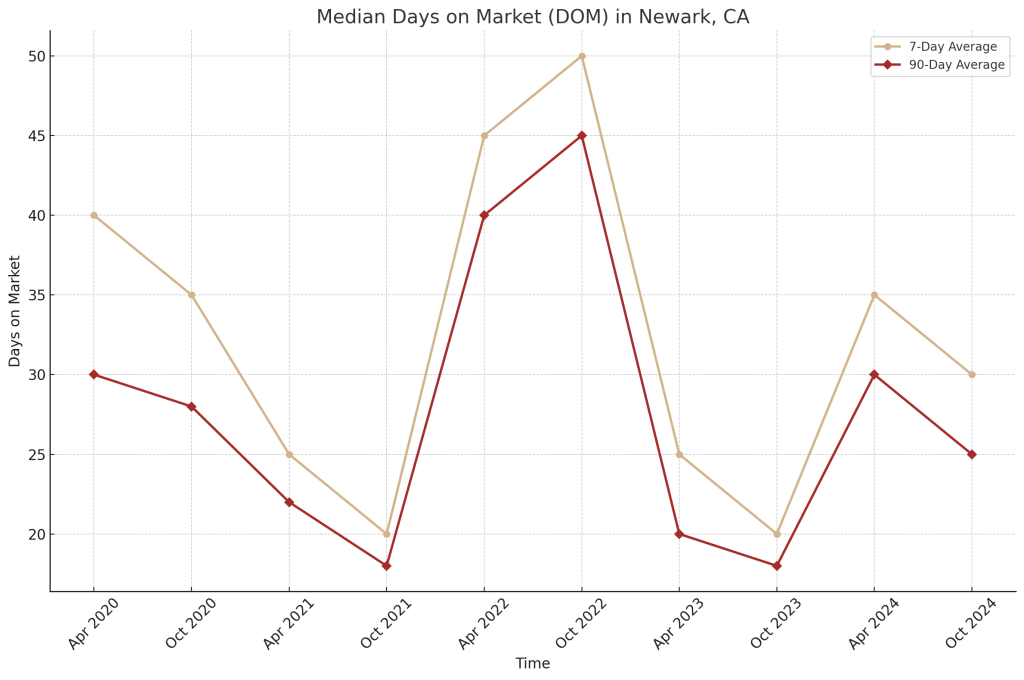
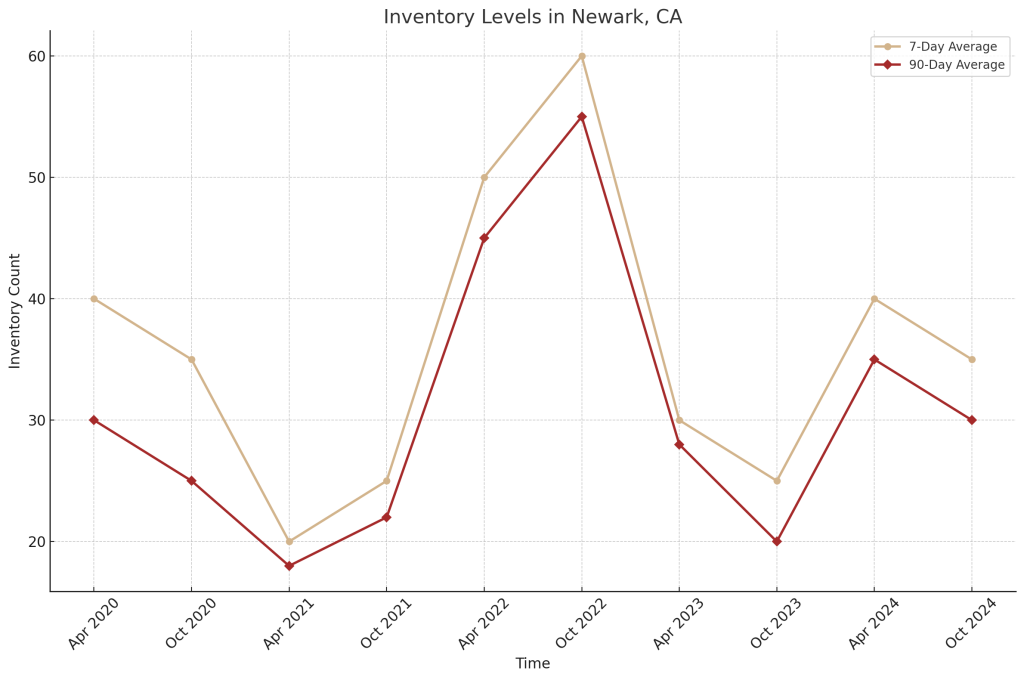
- 7-Day Average (tan line with circular markers)
- 90-Day Average (brown line with diamond markers)
Inventory and Days on Market
Inventory levels in Newark have decreased, with only 19 active listings as of this month. Low inventory, coupled with high demand, means it’s still a seller’s market. Homes have been averaging 42 days on the market, while the median number of days is 35. This indicates that about half of the homes are selling relatively quickly, showing robust buyer interest.
One key takeaway here is that if you are considering selling your home, now is a great time to list it, given the reduced inventory and heightened buyer competition.
Price Per Square Foot and Market Plateau
The current price per square foot is $912, which has shown some stagnation, much like the median list price. Prices seem to have leveled off across the board, signaling a temporary plateau. However, the Market Action Index indicates that the overall demand remains strong, which could push prices higher if inventory remains low.
Strong Seller’s Market
The market action index staying at 73 clearly indicates a strong seller’s market. Home sales have consistently outpaced supply, resulting in competitive conditions for buyers. If this trend continues, we could see further upward pressure on prices.
The Market Action Index serves as a reliable guide to understanding whether the market will favor buyers or sellers moving forward. Presently, it is highly favorable for sellers, which suggests a good opportunity to maximize profit if you’re planning to sell soon.
Days on Market Insights
The average days on market (DOM) is 36 for all properties, with half of the properties coming on the market in the past 22 days. Typically, higher-priced homes in Newark take a bit longer to sell compared to more moderately priced homes, which is consistent with the trends seen in neighboring areas.
Conclusion
The Newark, CA real estate market is clearly in favor of sellers at the moment. With inventory low, a high market action index, and a steady median list price, those looking to sell their homes are well-positioned to benefit from favorable conditions. Buyers, on the other hand, should be prepared for competition and act decisively to secure their desired property.
If you’re interested in learning more about the Newark real estate market or want to discuss your buying or selling options, feel free to reach out. Staying informed and proactive is key to success in this dynamic market.
Visual Insights for the Newark Real Estate Market
To help visualize the current market trends, I’ve created some easy-to-understand charts that illustrate:
Median List Price Trends: Showing changes over the past 12 months, highlighting the plateau.
Inventory Levels: Charting the decline in available listings and how it impacts the market.
Days on Market by Segment: Visualizing how quickly homes in different price ranges are selling.
These charts provide a visual representation to help better understand the Newark real estate market trends and make more informed decisions.
Feel free to contact me for personalized insights or any questions regarding your real estate needs.
Property Search in Newark: http://HarvinderBalu.com/NewarkRE
https://bit.ly/Newark-Properties
Direct Link for this post: https://harvinder.dscloud.me/blog/11/07/2024/newark-market-update-nov-2024/
Alameda County : Latest Inventory & Market Update: https://Harvinder.dscloud.me/blog/reports-by-cities/alameda-county/

Coming Soon: 36391 Cherry Street, Newark CA – Public Records Only
Coming soon listing at 36391 Cherry Street in Newark, California. Please note that the interior of this home has not yet been viewed, and all

What Does It Mean to Have a Dual Agent in Real Estate?
When you’re diving into the Bay Area real estate market, you might hear the term “dual agent” and wonder what it means for you as

Bay Area Housing Affordability: New California Reforms for 2025
Governor Newsom signs the 2025 housing affordability and infrastructure reforms in Sacramento. California faces a real housing challenge; any relief is welcome. Recently, on July
Related Posts

Open House Alert: Beautifully Remodeled 3-Bedroom Home in Hayward! Don’t Miss Out!

Open House – Your Dream Home Awaits at 35938 Argonne St, Newark, CA 94560

Open House Alert: 5598 Civic Terrace Ave, Newark, CA 94560. Bright and Open Floor Plan
About The Author
Harv
HarvRealtor.com | Harv Balu, CIPS, GRI, FTBS, PSA | Tech-savvy Realtor & proud father of 3, committed to seamless real estate journeys. With 15+yrs in IT & passion for real estate, I offer tailored services. Enthusiast photographer, green-thumbed gardener.
Add a Comment
Cancel reply
This site uses Akismet to reduce spam. Learn how your comment data is processed.
