
Milpitas, CA – As a seller, it’s crucial to grasp the intricate dance of real estate metrics, creating a symphony of data to guide your decisions. Understanding this correlation unlocks the door to making informed choices that resonate with market dynamics.

Let’s kick off with the Months Supply of Inventory – a key player in understanding market dynamics. At a mere 0.74 months, the low inventory hints at soaring demand for homes. 🏡💼 This scarcity tends to propel prices upwards and accelerates the pace of sales. 💰🚀
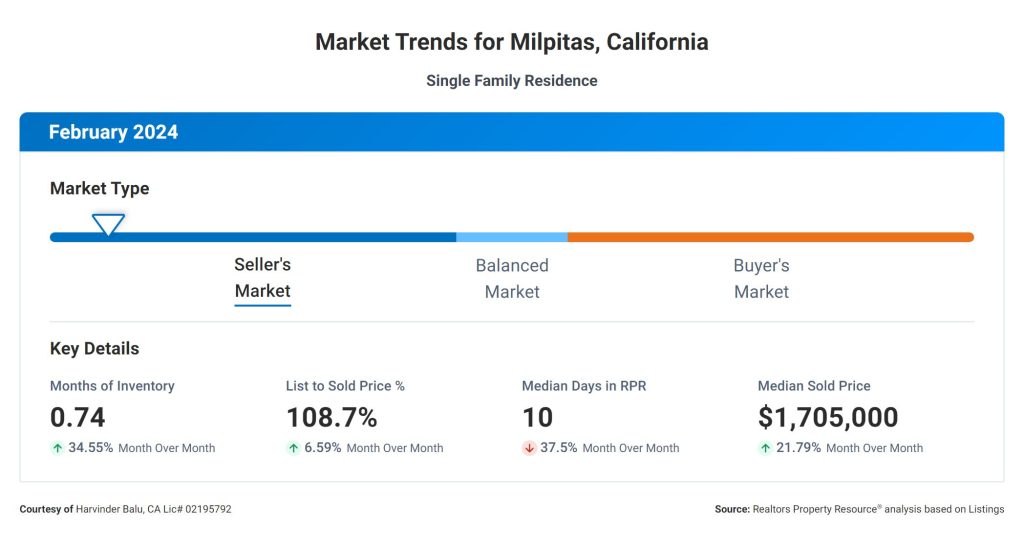
In a blink-and-you-miss-it timeframe, the Median Days Homes are On the Market stands at just 10 days! 📆💨 This swift turnover underscores the high-speed nature of the market. Homes are flying off the shelves, driven by robust demand and limited inventory levels. 🏡💰 Get ready for a whirlwind in the real estate world! 🌪️🏠
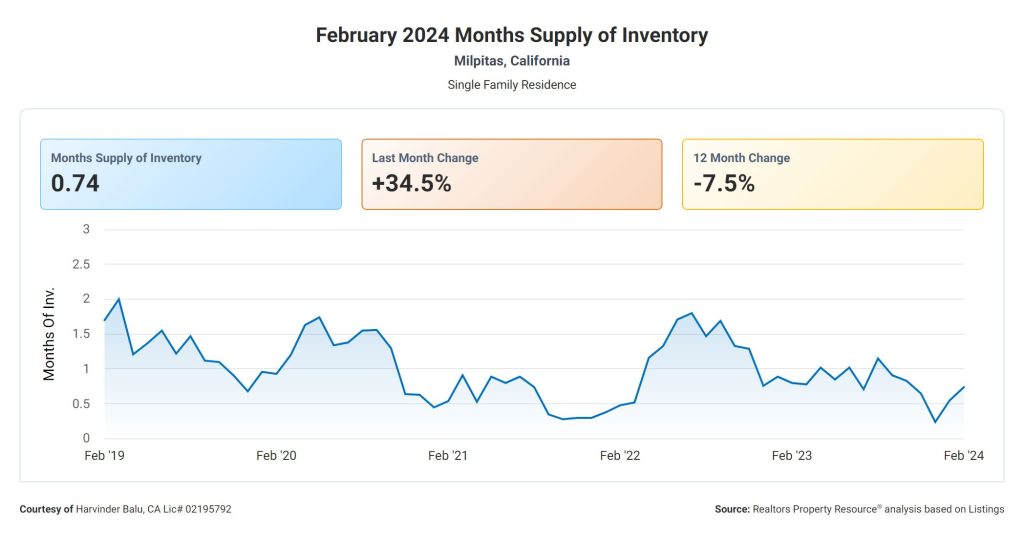
The 12-Month Change in Months of Inventory has seen a remarkable -7.5% shift, signaling a notable acceleration in home sales. 📉 This trend paints a picture of a market tightening its grip, with homes flying off the shelves faster than in previous years. ⏳🏡
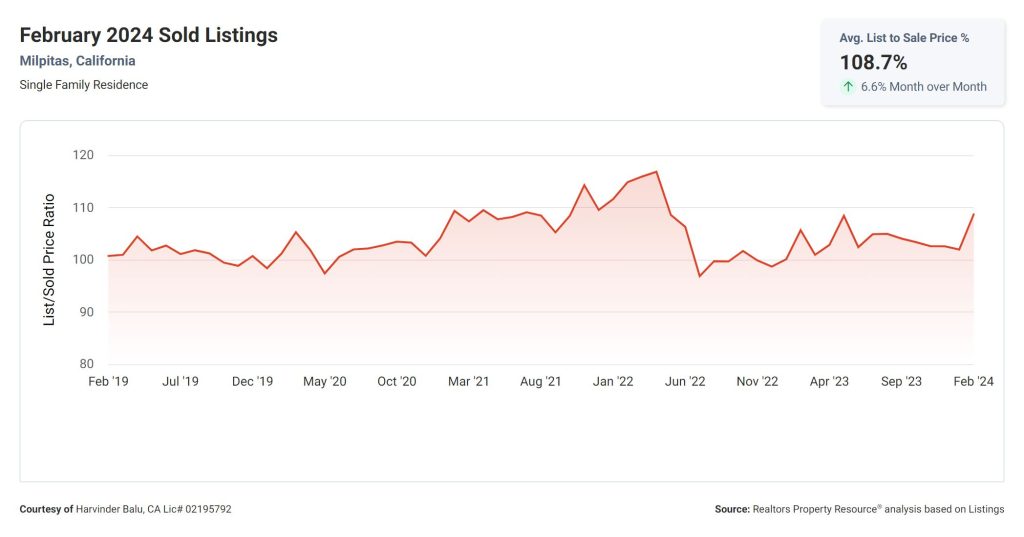
The List to Sold Price Percentage is an impressive 108.7%! 📈💰 This positive sign not only spells good news for sellers but also reveals the fierce competition among buyers. 🏡🔥 Bidding wars and competitive offers are likely contributors, fueled by the limited supply of homes on the market. ⚔️🏠
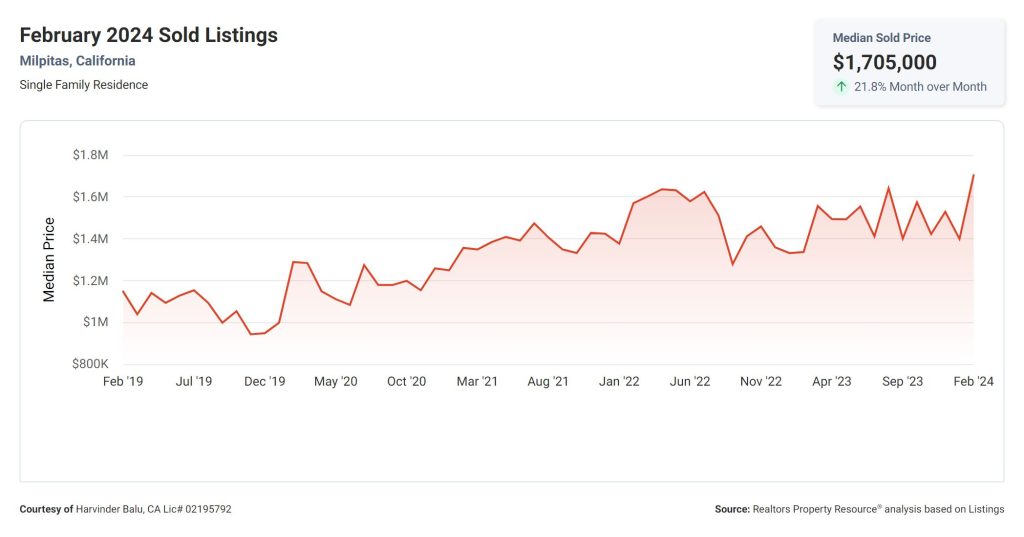
Overall, these metrics paint a vibrant picture of the real estate market, featuring high demand, low inventory, and ascending prices. 🎨📈 As a seller, now may be the opportune moment to list your property and seize the advantages offered by these favorable market conditions. 🏡💼✨
Links for this post:
http://RealtorHarvinder.com/milpitas24
Direct Link:
https://harvinder.dscloud.me/blog/03/09/2024/milpitas-feb2024/
Facebook Post: https://www.facebook.com/photo?fbid=122143948010083474&set=a.122115162518083474

Last Month’s Report:
https://harvinder.dscloud.me/blog/02/17/2024/market-report-for-milpitas-ca/