Unlock Tremendous Value: Fremont Homes Selling at Record Pace! 2024
Fremont, CA Real Estate Market Update: June 2024
Welcome to the latest edition of the Fremont, CA real estate market update. If you’re considering selling your home in Fremont, this comprehensive guide will provide you with the essential information you need to make an informed decision. From current price trends to inventory levels, we cover all the critical aspects of the Fremont housing market. Let’s dive in!
1. Fremont Housing Market Overview
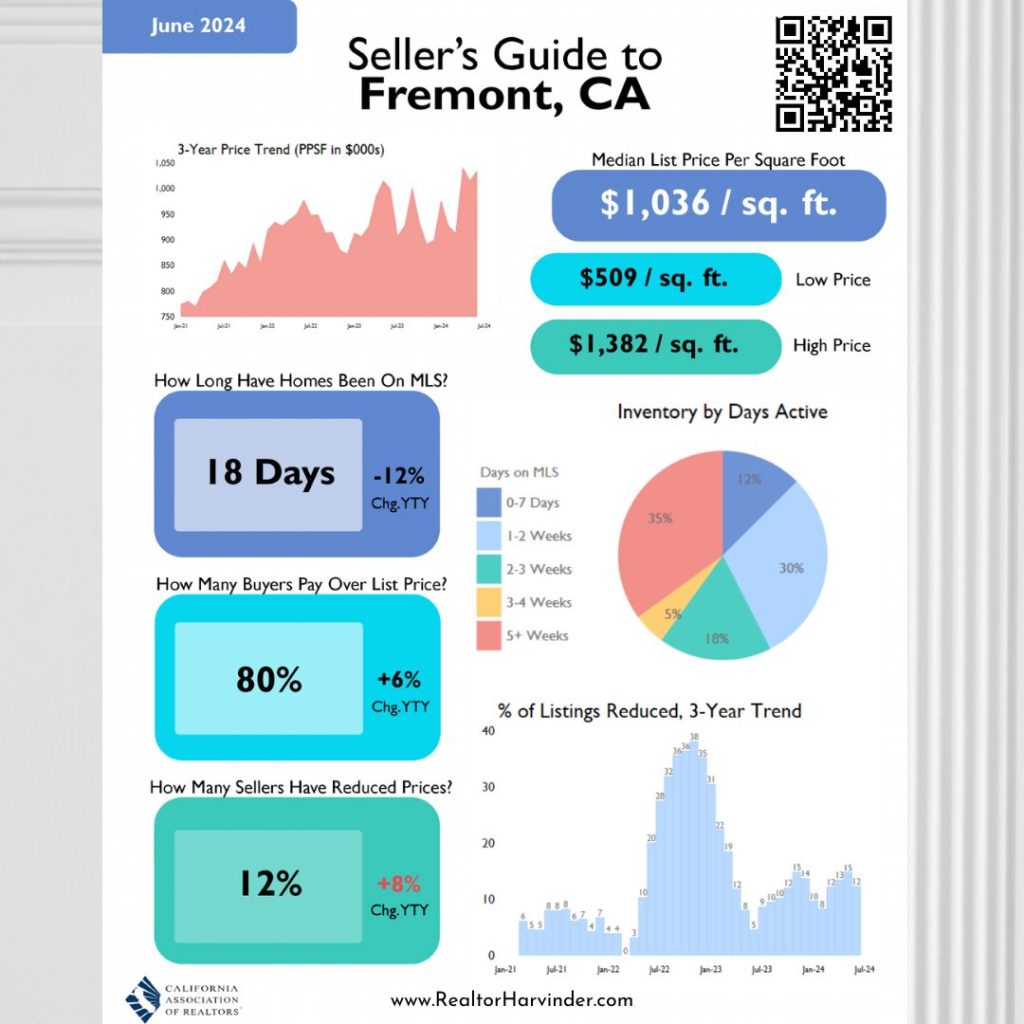
3-Year Price Trend
The Fremont housing market has experienced notable fluctuations over the past three years. As of June 2024, the price per square foot (PPSF) has shown a resilient upward trend, currently averaging at $1,036. This price represents a significant increase from earlier years, indicating a robust market.
Median List Price Per Square Foot
- Median List Price: $1,036/sq. ft.
- Low Price: $509/sq. ft.
- High Price: $1,382/sq. ft.
These figures highlight the diversity in property values across Fremont, offering opportunities for both budget-conscious buyers and those seeking luxury homes.
2. Market Dynamics
Days on Market
One key indicator of market health is how long homes stay on the market. Currently, homes in Fremont spend an average of 18 days on the Multiple Listing Service (MLS), a 12% decrease year-over-year (YoY). This quick turnover suggests a strong demand for homes in the area.
Buyer and Seller Behavior
- Buyers Paying Over List Price: 80% (+6% YoY)
- Sellers Reducing Prices: 12% (+8% YoY)
A substantial 80% of buyers are willing to pay over the list price, which indicates a competitive market. On the other hand, 12% of sellers have reduced their prices, which might reflect an adjustment to more realistic market expectations or pricing strategies to attract buyers.
3. Inventory and Listings
Inventory by Days Active
The distribution of active listings by their days on the market provides insight into inventory turnover:
- 0-7 Days (Blue): 12%
- 1-2 Weeks (Light Blue): 30%
- 2-3 Weeks (Green): 18%
- 3-4 Weeks (Yellow): 5%
- 5+ Weeks (Red): 35%
Most homes are sold within the first two weeks of listing, further underscoring the market’s brisk pace. This fast turnover can be advantageous for sellers looking to close deals quickly.
Percentage of Listings Reduced
Over the past three years, the percentage of listings that have seen price reductions has varied, peaking during mid-2022 but showing a downward trend more recently. As of June 2024, the rate of listings with reduced prices has stabilized, suggesting sellers are becoming more adept at setting competitive prices from the outset.
4. Implications for Sellers
If you’re planning to sell your home in Fremont, here are a few tips to consider based on the current market trends:
- Price Competitively: Given the high percentage of buyers paying over the list price, setting a competitive and realistic price can attract serious offers quickly.
- Prepare for Quick Sales: With homes spending an average of just 18 days on the market, be prepared for a swift selling process. Ensure all necessary paperwork and preparations are in order to avoid delays.
- Monitor Market Dynamics: Stay informed about the latest market trends and adjust your strategy accordingly. For instance, if the percentage of price reductions increases, it may be wise to review and adjust your pricing strategy.
June 2024 Highlights
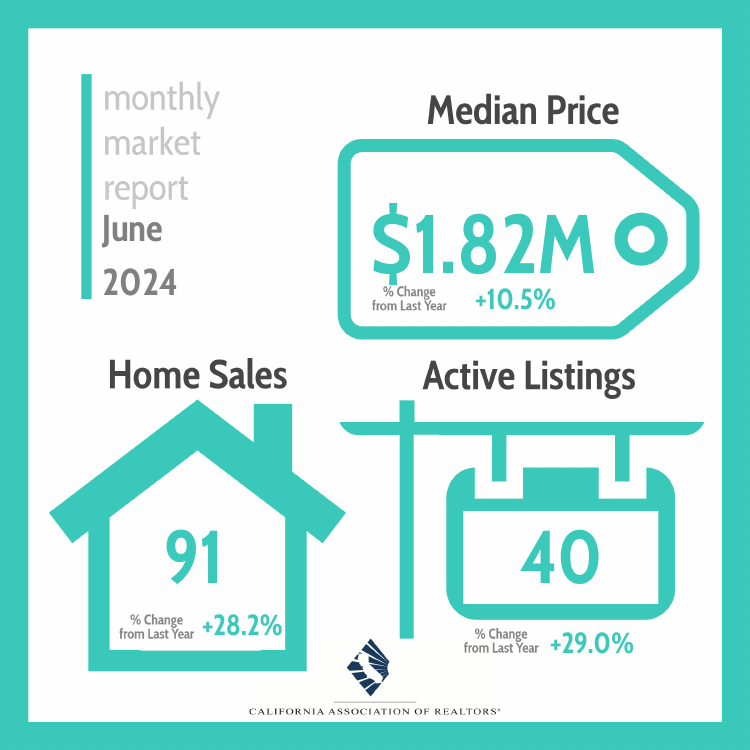
The Fremont real estate market continues to thrive in June 2024, presenting exciting opportunities for sellers. The median home price has climbed to $1.82 million, showing a robust 10.5% increase from the previous year. Home sales have surged, with 91 homes sold, reflecting a significant 28.2% rise. Additionally, the number of active listings has grown to 40, a notable 29.0% increase. These positive trends indicate a dynamic and competitive market, making it an ideal time for homeowners to sell. Leverage these insights to maximize your property’s potential in Fremont’s booming real estate landscape.
Key Insights for Sellers
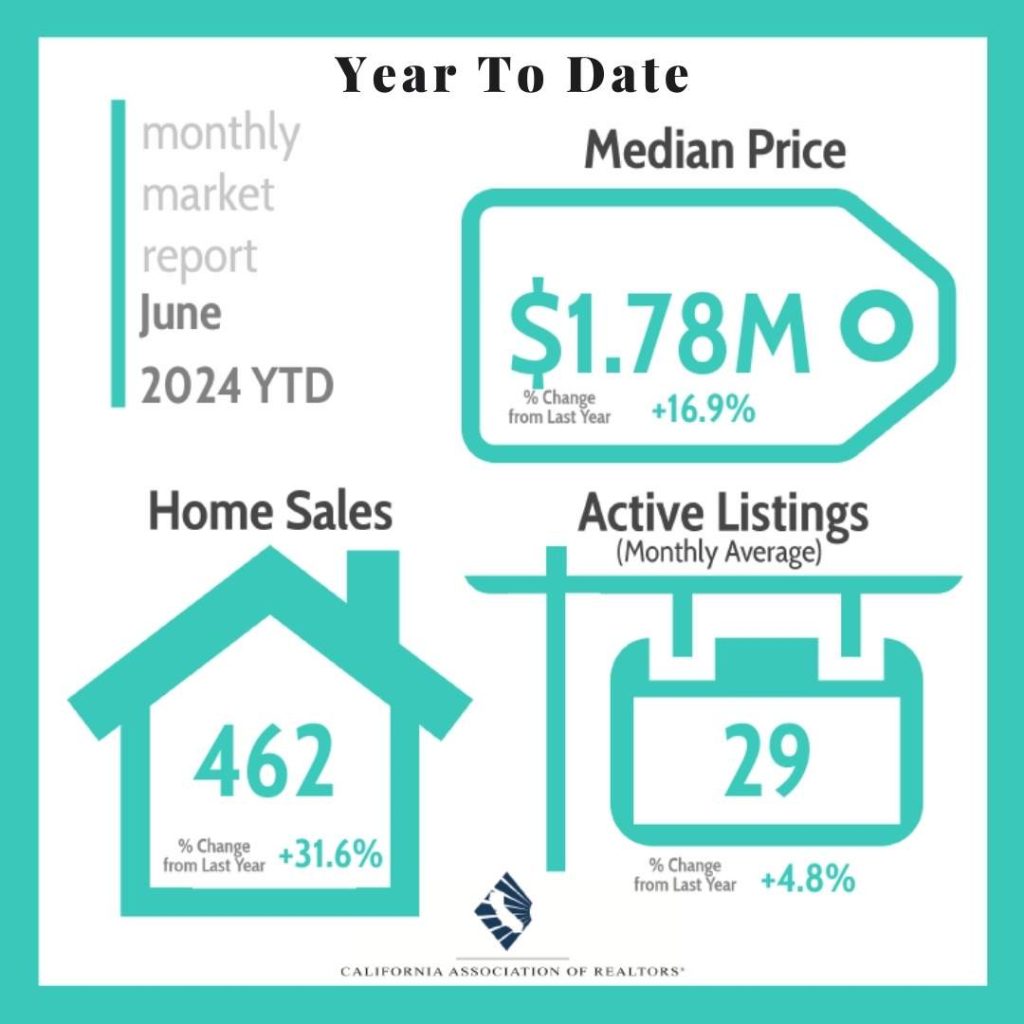
The Fremont real estate market is thriving in 2024, showing impressive gains across key metrics. The median home price has soared to $1.78 million, marking a 16.9% increase from last year. Home sales are up by a remarkable 31.6%, with 462 homes sold year-to-date. Active listings have also seen a boost, averaging 29 per month, a 4.8% rise from the previous year. This robust market growth underscores Fremont’s appeal and offers lucrative opportunities for sellers. Stay informed and capitalize on this dynamic market with insights from your local real estate experts.

5. Conclusion
The Fremont, CA real estate market remains vibrant and dynamic, characterized by fast-moving inventory and competitive pricing. For sellers, this is an opportune time to leverage the market’s strengths and achieve favorable outcomes. By understanding and adapting to the current trends, you can navigate the selling process more effectively and maximize your property’s value.
For personalized advice and further insights into the Fremont real estate market, don’t hesitate to contact me as your local real estate professional. I can provide tailored guidance to help you make the most informed decisions possible.
Stay tuned for our next market update, where we’ll continue to keep you informed about the latest trends and developments in Fremont’s real estate landscape.
Link to Listings in Fremont: http://RealtorHarvinder.com
Short Link for this post:
http://bit.ly/fremont0624
http://HarvinderBalu.com/fremont624
Direct Link for this post: https://harvinder.dscloud.me/blog/07/18/2024/fremont-june2024/
Alameda County : Latest Inventory & Market Update: http://RealtorHarvinder.com/alameda

Related Posts

Home Maintenance: Spring Home Checklist & Home Care Tips 2025
Newark, CA Real Estate Market Insights Nov. 2024 -Strong Seller’s Market Continues

Unlock Lucrative Deals in Milpitas’ Booming Real Estate Market! 2024
About The Author
Harvinder Balu
Harvinder Balu | CA DRE 02195792 | 510-600-3425 | info@RealtorHarvinder.com | http://www.RealtorHarvinder.com
